Find actionable marketing insights using Excel and Google Sheets
Online course:
Excel for marketers
By Fred Pike, Managing Director at Northwoods
Course length: 4h 30m
Some of the companies that train their teams at CXL Institute:


Find actionable marketing insights
Everyone thinks they know Excel, but this dismissive assumption may be costing you a lot of growth opportunities and wholly avoidable headaches.
Throughout this in-depth course, you will learn to
- Import data from multiple sources into Excel or Sheets.
- Discover the best way to tie this data together and make it useful.
- Understand when to use pivot tables and the different lookup types (vlookup, hlookup, and index/match).
- Understand basic spreadsheet troubleshooting skills.
- Learn how to use many of the data-manipulation commands in Excel/Sheets.
- Learn how to apply formulas and work with data to pull insights.
- Analyze data and answer business questions using spreadsheets.


You’re at a huge loss if you can’t functionally use spreadsheets
The business world runs on Excel. You’d be hard-pressed to find a business that doesn’t use it. If you work in growth, marketing, analytics, product, or content, chances are you use it on a daily basis.
Unfortunately, you’re probably not as proficient at Excel as you think you are. It’s not an insult, and it’s certainly not a falsity. In reality, most marketers are just scratching the surface when it comes to spreadsheet work
Combine data sources to discover even more marketing insights
Whether you’re analyzing sales data or calculating the performance of marketing strategies, you’ll find yourself using Excel. Excel can help you optimize your marketing processes, tweak and decide on campaigns, and even track day to day variations in data. No one in the digital world should be operating without this skill.
Most digital marketing tools let you interact with data within their own platform. This is often perfectly fine to view and analyze data, especially at a high level. However, you most likely have multiple sources of data, and it’s almost always the case that these sources of data can be blended to reach deeper conclusions about your marketing efforts.
Pull the data to Excel or Google Sheets
Once there, you have tremendous flexibility and power to link the data and get insights. It’s not necessarily difficult to use Excel, it’s just that Excel isn’t usually taught in a way that is practical and focused on generating actionable insights. In addition, it’s rare you’re shown step-by-step instructions on how to use its more advanced features.
That’s why we created this course.
This course won’t give you prepackaged takeaways – you know your data and its nuances more than we ever could. But what this course will do is teach you how to use Excel efficiently to uncover those insights on your own. It will be another tool in your arsenal – a very effective tool, at that – to make better marketing decisions.
Don’t just scratch the surface
This course is perfect for beginners seeking to learn how to utilize Excel to manage and extract meaning from data, specifically in relation to marketing. Even if you’ve spent a lot of time in Excel, it’s likely you’ll learn some more advanced techniques to get more out of the tool.
Most of the examples will be drawn from marketing tools you use every day – Google Analytics, Search Console, AdWords, Moz, etc. If you’re a marketer, you’ll receive concrete, explicit, and immediately actionable takeaways from this course.
This course will primarily focus on Excel, but we’ll also touch on Google Sheets, as it’s often easier to access data there.

This course is right for you if…
- Your daily work includes working with data across multiple tools (e.g. Google Analytics, Google Search Console, SEMRush, Moz, AdWords. Keyword Planner, etc.)
- You are sometimes stymied by the data analysis capabilities of those tools, and would like to dive deeper or dive more broadly
- Your success and future growth depends on being able to discover the links between data sets
This course is probably not for you if…
- You can do pivot sheets and vlookups in your sleep
- You know best practices in setting up spreadsheets and formulas including troubleshooting errors
- You’ve written and debugged Excel macros
Skills you should have before taking this course
- You should have at least a basic and introductory familiarity with spreadsheets
- e.g. how to create formulas, import files, possibly create some simple graphs, etc.
- More importantly, you should have an understanding of your data and what type of information you want to draw out of it.
About your instructor, Fred Pike

Fred started his career using Visicalc, the very first electronic spreadsheet, and has been a spreadsheet aficionado ever since.
He is a Managing Director at Northwoods, where most of his client work is centered on Google Analytics and Google Tag Manager implementations. His previous course for CXL, “Using the Google Analytics API add-on with Google Sheets,” was a well-received introduction for non-programmers to the nuances of the Google Analytics API.
Fred is very active in digital marketing for the classical and jazz-mandolin world. He runs SEO and email campaigns, as well as PPC and Facebook ads, for different artists and events. He is widely considered one of the top-10 mandolin marketers in the world (out of a group of about five or so). He is the president of the Milwaukee Mandolin Orchestra and a board member of the Classical Mandolin Society of America.
Outside of work, Fred is a runner and has been a ski instructor for about 14 years. He is also an active pit musician, having played guitar or bass in well over 100 productions.
After this course, you’ll be able to…
- Import, blend, and analyze data from multiple sources.
- Format the data in a way to best work with it and share it across teams.
- Execute pivot table analysis, common (and powerful functions), and different types of lookups (vlookup, hlookup, and index/match).
- Do basic troubleshooting and fix mistakes most people make when working with spreadsheets.
- Use many of the data-manipulation commands in Excel/Sheets.
- Generally be an efficient and effective spreadsheet user, able to pull insights from many data sources and work with it to answer business questions.
Your full course curriculum
Excel for Marketers
1 Getting started with Excel
2 Documenting and troubleshooting your work
3 String manipulation and creating links between data sources
4 Forecasting, third-party tools, and shortcuts
Show off your new skills: Get a certificate of completion
Once the course is over, pass a test to earn a CXL certification.
Add it to your resume, your LinkedIn profile or just get that well-earned raise you’ve been waiting for.
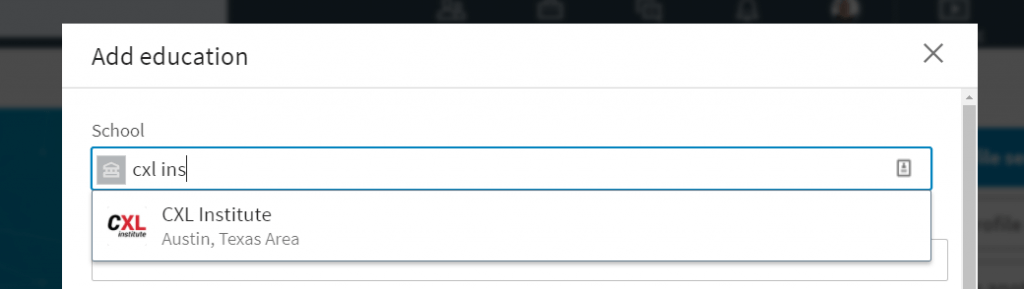
CXL Institute is an authorized LinkedIn education provider
You can add your education, certificates, badges – everything you learned and earned at CXL Institute into the Education section of your profile.
Need help getting your employer to pay for this program?
Click here for pitch deck, swipe files, and tips.
Enroll to CXL Institute now:
Some of the companies that train their teams at CXL Institute: