Learn how to present data to change minds and facilitate action
Online course:
Data Presentation & Visualization Training
By Lea Pica, Ian Littlejohn, Judah Phillips
Course length: 9h 30min
Some of the companies that train their teams at CXL Institute:


Are your executives and clients falling asleep during your data presentations?
Chances are your slide design and data visualizations are obscuring your valuable insights, and you’re not communicating in a way that changes minds.
This course will give you a fresh new toolbox that will get you and your data presentations remembered and acted upon.
In just 5 sessions, you’ll be able to…
- successfully think about understanding, organizing and planning for success with digital analytics
- deliver insights in way that makes people actually care and do something about it
- create effective and impressive slide decks to tell stories with data
- build powerful and interactive data visualizations with Google Data Studio


Throwing numbers at people doesn’t work – tell stories with data to get results
Stories are very effective tools to communicate data and analysis. Narrative is the way we simplify and make sense of a complex world. Storytelling with data supplies context, insight, interpretation—all the things that make data meaningful and analytics more relevant and interesting.
Best stories combine both evidence of analysis and data, plus adds a point of view or example that involves real people and organizations.
Engaging presentations can lead to people caring about data, and taking action about it
But even stories and great presentations alone are not enough. You also need to learn how to follow-through and close out analytical activities in ways that help people make decisions that lead to net positive business outcomes.
This course will
- teach you how to tell compelling stories with data
- show you how to craft engaging slide decks and dashboards
- help you change hearts and minds to act upon the data


This course is right for you if…
- You need to share data from marketing campaigns, A/B tests or analytics with clients or colleagues
- Your skills with building slide decks could use an improvement
- Your presentations are not leading to action
This course is probably not for you if…
- You’re an award-winning slide deck designer
- You’re a master storyteller
Skills you should have before taking this course
- Basic digital analytics knowledge, familiarity with tools like Google Analytics
- You’ve built a slide deck before with PowerPoint or Keynote
About your instructors
Lea Pica
Storyelling Director, @ Search Discovery

Lea Pica is a seasoned digital analytics practitioner, social media marketer and blogger with over 11 years of experience building search marketing and digital analytics practices for companies like Scholastic, Victoria’s Secret and Prudential.
She’s spoken for industry conferences and company summits including eMetrics, Web Analytics Demystified, ForeSee, and InfoTrust. Her signature “Get Their Attention” session about presenting data effectively was a top-rated session in every industry event to date, including the #1-rated session out of 42 presentations at eMetrics San Francisco 2015.
Ian Littlejohn
Data Insight Training UK

Ian has consulted and worked with major organizations in the Banking, Insurance, Manufacturing, Telecommunications and Logistics industries across a number of countries and continents.
For 10+ years, Ian has been making it easy for his students to craft management reports, develop interactive dashboards and generate new insight and intelligence from business data.
Judah Phillips
Data and Analytics Entrepreneur

Judah Phillips helps people create value with analytics and data science by improving business performance, increasing revenue, reducing cost, boosting profitability, and increasing customer satisfaction.
Judah has worked with Internet companies, Media and Marketing companies, Consumer Product companies, Automotive Companies, Financial Services firms, Pharmaceutical companies, and many different agencies, including high-growth, early stage startups and the Fortune 10.
Your full course curriculum
Data presentation & visualization
1 Introduction + Conceptualize
2 Visualize: design like Andy Warhol
3 Visualize: data design
4 Analytics strategy: the process for successful digital analytics
5 Analytics strategy: socializing analytical results for enabling business decisions
Data Studio Masterclass
1 Data source connections and requirements
2 Building your first report
3 Chart options and principles of visualization
4 Putting it all together – full report workshop


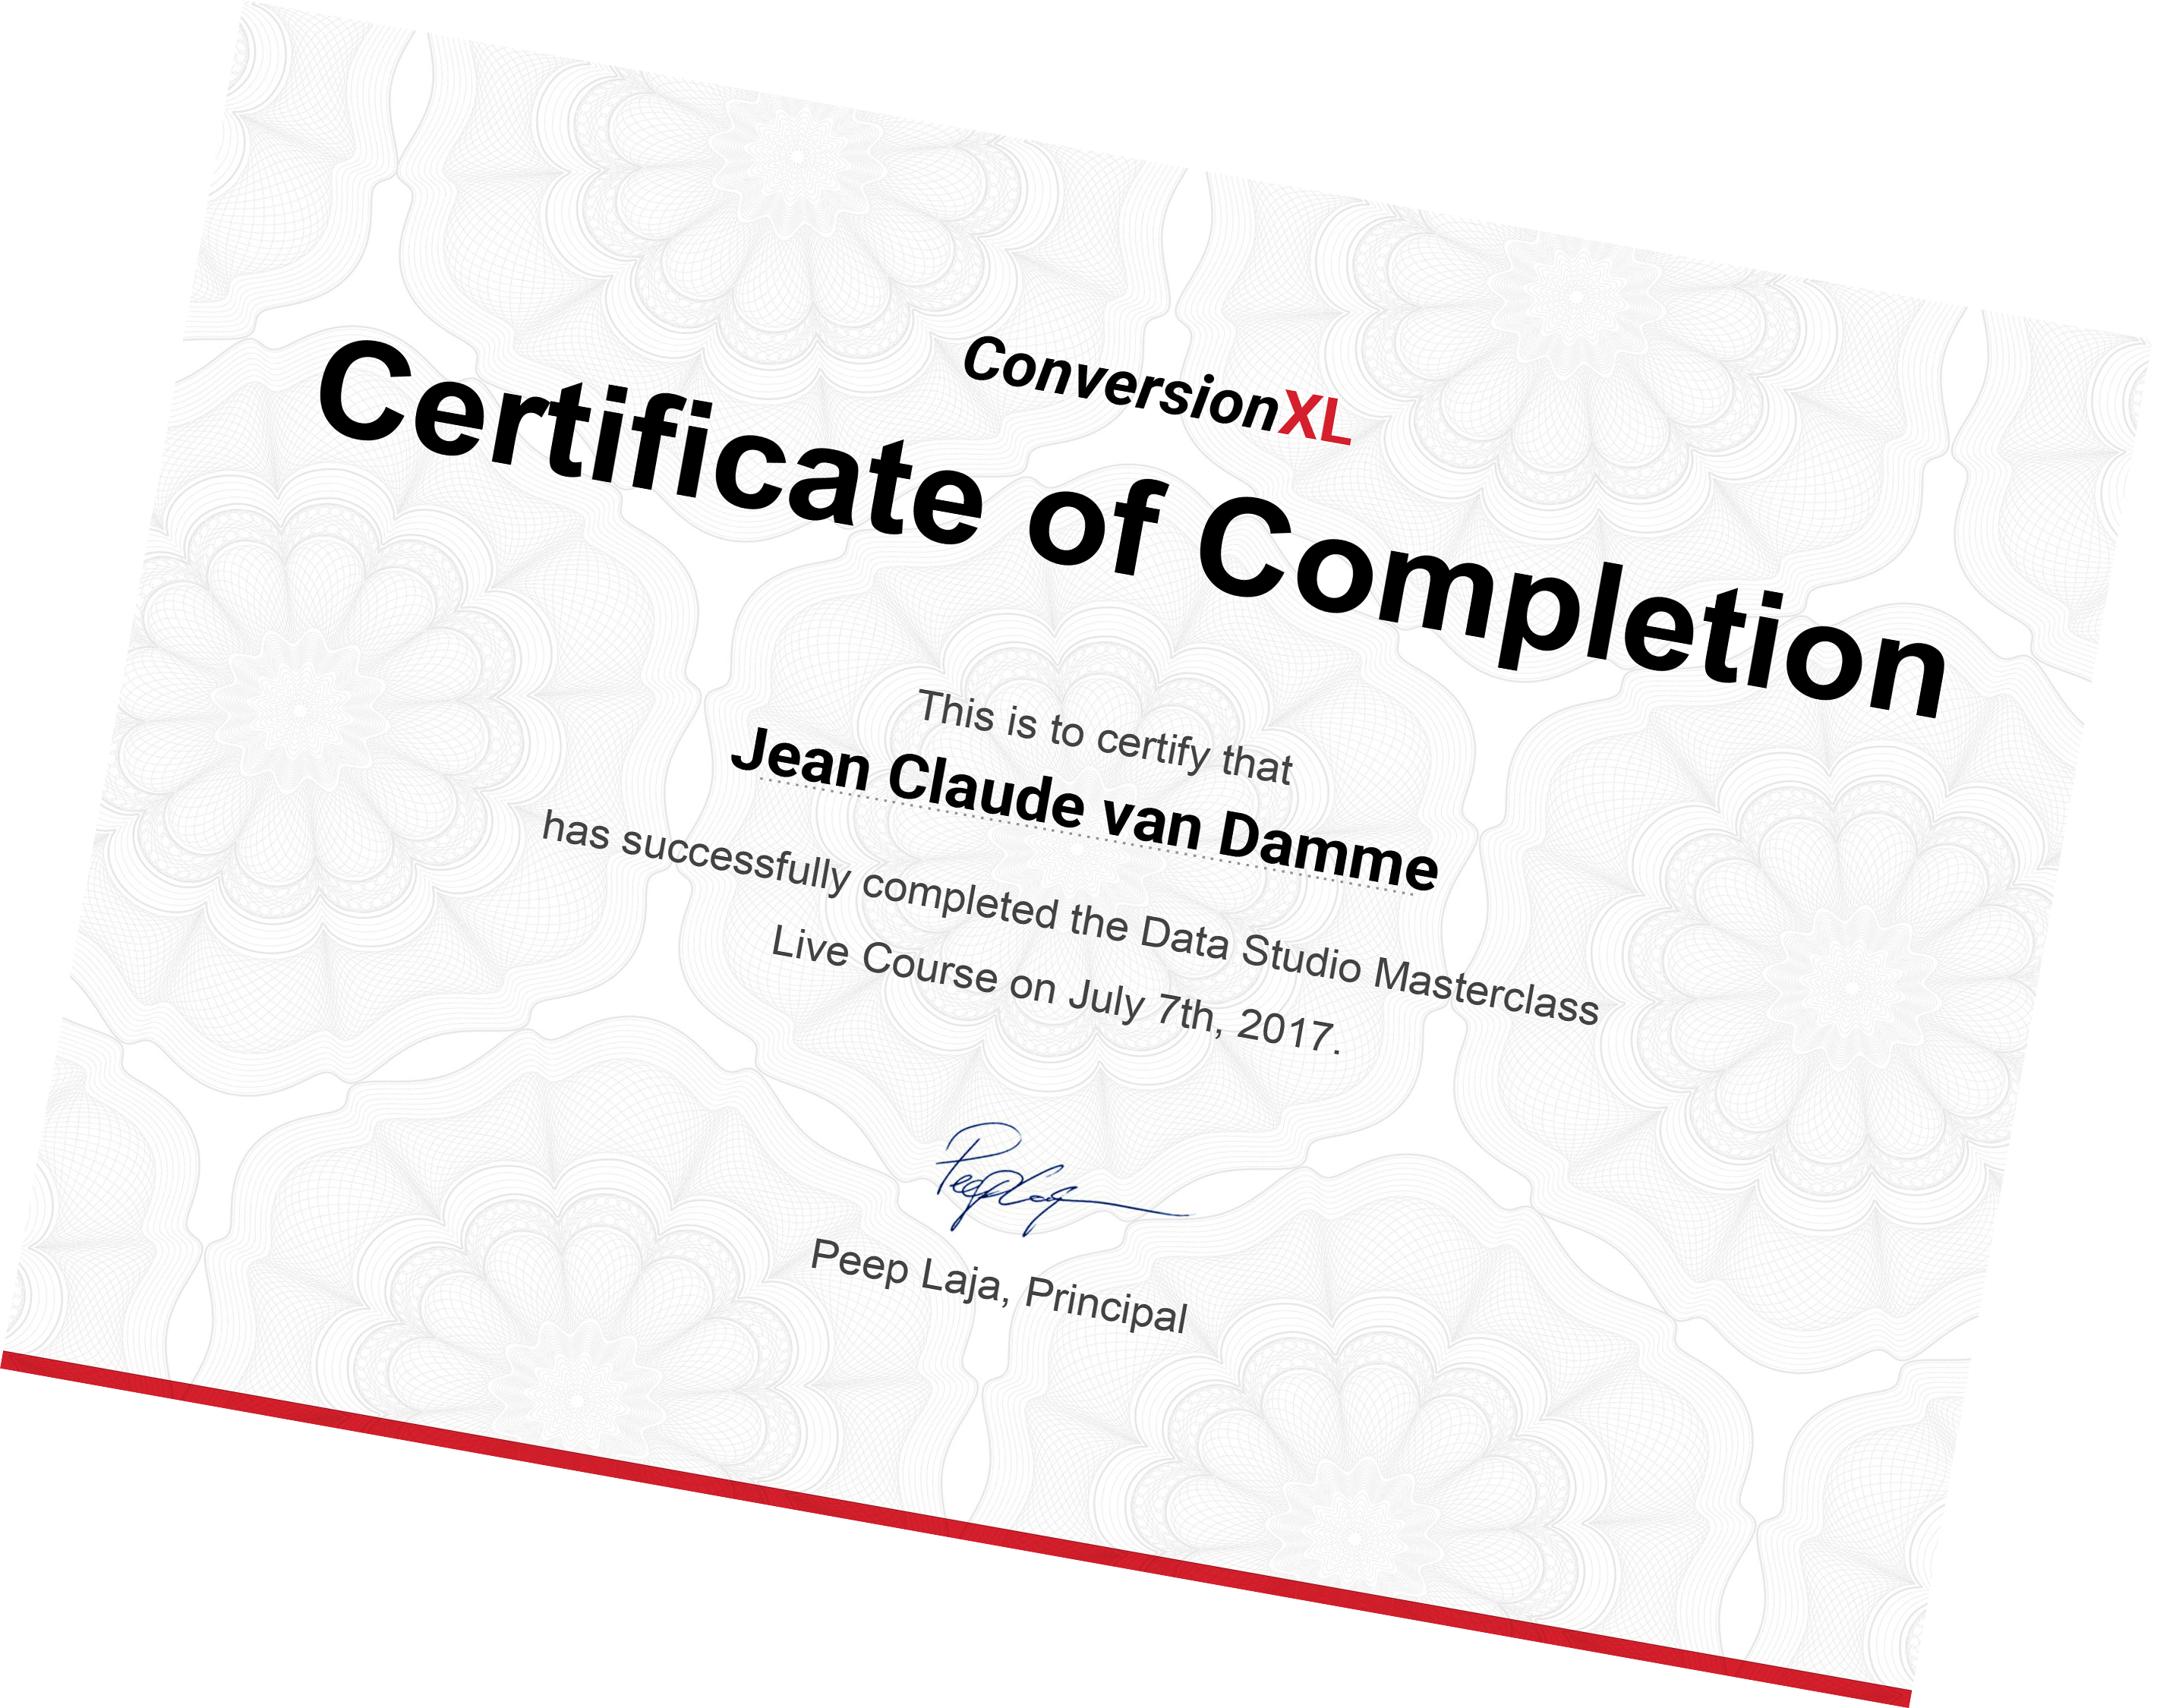
Show off your new skills: Get a certificate of completion
Once the course is over, pass a test to earn a CXL certification.
Add it to your resume, your LinkedIn profile or just get that well-earned raise you’ve been waiting for.

CXL Institute is an authorized LinkedIn education provider
You can add your education, certificates, badges – everything you learned and earned at CXL Institute into the Education section of your profile.

Need help getting your employer to pay for this program?
Click here for pitch deck, swipe files, and tips.
Enroll to CXL Institute now:
Some of the companies that train their teams at CXL Institute:


